
Kubernetes Resource Optimization: From Manual Tuning to Automated Benchmarking
BenchTest makes Kubernetes resource optimization simple. Benchmark workloads, find the right CPU/memory settings, and eliminate waste before production.
Rethinking Kubernetes Resource Optimization
In our previous post, Why We Built BenchTest, we dug into one of the most persistent pain points in Kubernetes: getting CPU and memory requests and limits right. Kubernetes gives you precise control through requests and limits, but almost no guidance on how to choose values that truly match your application’s needs.
That delicate balance between cost, performance, and reliability is at the heart of Kubernetes resource optimization. Requests that are too high waste money and reduce cluster density; requests that are too low cause throttling, latency, and instability. Finding the sweet spot means understanding exactly how your workloads behave, something that changes with every release, dependency update, and usage pattern shift.
Most teams try to size their workloads using production metrics, historical data gathered from observability tools like Prometheus, Datadog and New Relic. These insights are valuable, but they’re inherently reactive: you’re making tomorrow’s decisions with yesterday’s numbers, often collected from workloads running older versions of your software under different traffic patterns. In fast-moving environments where containers are rebuilt and deployed weekly or even daily, those metrics go stale quickly. By the time you spot an inefficiency, it’s already affecting cost or performance, and optimization becomes a loop of tuning, redeploying, and hoping for improvement, always a step behind reality.
The real challenge of Kubernetes resource optimization isn’t visibility, it’s prediction. Teams need a way to validate configurations before deployment, using data that reflects how an application will behave under load, not how it behaved weeks ago under different conditions. Without that foresight, optimization remains a guessing game, and every release resets the cycle.
In the rest of this article, we’ll look at how teams approach resource optimization today, why manual methods often fall short, and how BenchTest.dev helps automate the process through data-driven benchmarking.
Traditional Approaches to Kubernetes Resource Optimization
Once teams recognize how much over- or underprovisioning costs them, they usually turn to Kubernetes’ built-in mechanisms and ecosystem tools to tune performance. These solutions form the foundation of most Kubernetes resource optimization efforts, but they also come with trade-offs.
Metrics and Monitoring
Tools like Prometheus, Grafana, and commercial platforms such as Datadog are often the first step toward visibility. Prometheus scrapes metrics directly from Kubernetes components, nodes, and workloads, typically through exporters like cAdvisor or kube-state-metrics, while Grafana or Datadog visualize that data across dashboards showing CPU, memory, and I/O utilization.
Many teams use these historical metrics to guide resource configuration. A common approach is to analyze CPU and memory utilization over a defined period, typically one to four weeks of production data, and calculate statistical percentiles to estimate steady-state demand. For example, engineers might look at the 95th or 99th percentile CPU usage for each container to determine a baseline request value, then add a small buffer (for instance, +10–20%) to absorb short spikes. Memory is often treated more conservatively, since out of memory errors can crash pods, teams might set memory requests closer to roughly 1.2–1.5× the observed peak level.
These calculations can be automated with queries in PromQL, Datadog monitors, or tools like Goldilocks, which analyze the official Kubernetes metrics container_cpu_usage_seconds_total and container_memory_working_set_bytes and output recommended request and limit values. This data-driven method provides a measurable starting point, but it’s still based on historical averages, not predictive behavior. When workloads change due to new code, dependencies, or user patterns, those “optimal” numbers quickly drift out of date.
Monitoring remains essential, but it’s reactive by design. You only see what happens after workloads are deployed, turning optimization into a continuous loop of observe → adjust → redeploy. These tools highlight anomalies and inefficiencies, but they can’t predict or prevent them, leaving teams to make tuning decisions based on yesterday’s performance instead of tomorrow’s demand.
Autoscaling
Kubernetes offers several autoscaling mechanisms to help absorb fluctuating demand:
- Horizontal Pod Autoscaler (HPA) [1] adjusts the number of pod replicas based on CPU or memory utilization, or on custom metrics such as request latency or requests per second.
- Vertical Pod Autoscaler (VPA) [2] recommends or automatically updates CPU and memory requests for containers. When run in "auto" mode, it can evict and restart pods to apply new values.
- Cluster Autoscaler [3] and newer tools like Karpenter scale the underlying node pool up or down based on overall cluster demand.
Autoscalers are powerful, but they rely on accurate baseline requests. If those requests are too high, autoscalers waste resources and inflate costs; if they're too low, workloads throttle or crash even as new nodes spin up. In both cases, scaling amplifies misconfiguration rather than correcting it. Research from Google Cloud [4] confirms that poor resource sizing directly affects both autoscaling efficiency and application stability.
Cost Visibility and Reporting
Tools such as Kubecost and its open-source counterpart OpenCost provide valuable insight into where cloud spend goes. They correlate usage with pricing data, helping teams pinpoint which namespaces or deployments are driving cost. Yet, like monitoring tools, they only diagnose inefficiency, not resolve it. Engineers still have to translate those insights into manual configuration changes.
The Manual Optimization Loop
Most organizations end up in a continuous feedback loop:
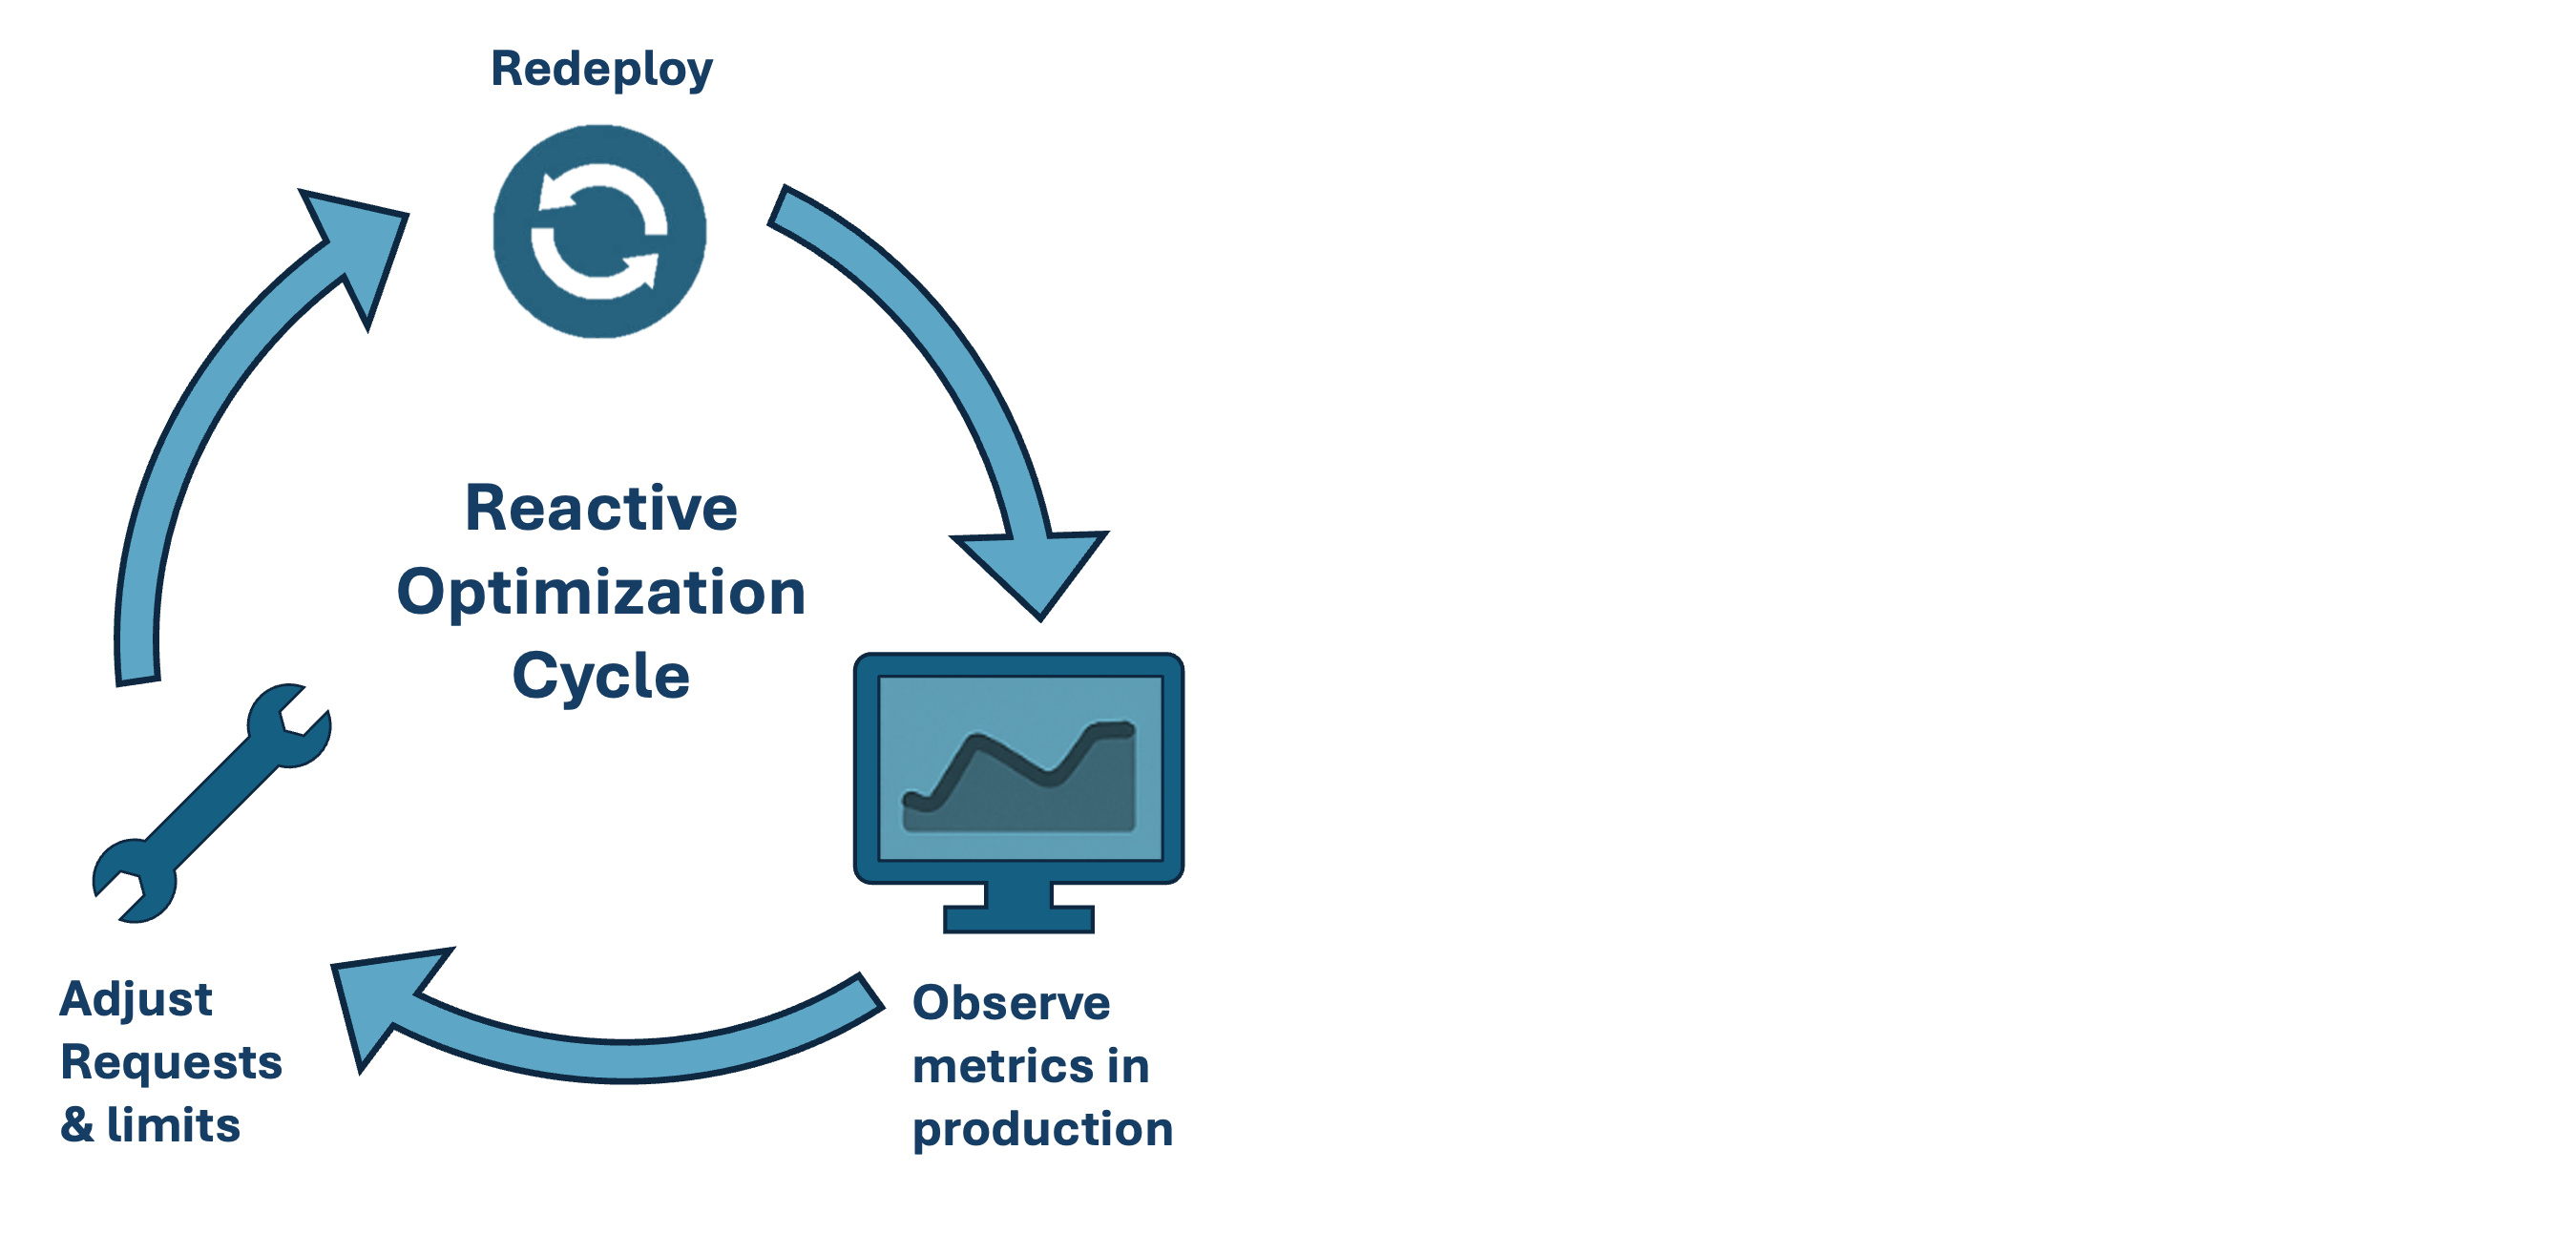 This iterative process improves things incrementally but rarely achieves true efficiency. It’s time-consuming, inconsistent, and heavily dependent on production traffic patterns that change from week to week.
Ultimately, traditional tools make Kubernetes resource optimization visible, not automatic. They expose the symptoms but don’t prescribe the cure and that’s where automation and benchmarking tools like BenchTest.dev begin to shift the paradigm.
The Limits of Manual Resource Optimization
Even with strong observability and autoscaling in place, most teams still find Kubernetes resource optimization to be a game of educated guesswork. Traditional tools reveal what happened in production, not what should happen, leading to a constant cycle of adjustment without ever reaching true efficiency.
The main limitation is timing. Most optimization happens after workloads are deployed, based on production metrics that reflect past behavior. By the time issues surface, they’ve already affected cost or performance. Every code change, dependency update, or configuration tweak shifts how an application consumes CPU and memory, forcing teams to retune continuously. It’s a process that’s reactive by nature, always one step behind.
Manual optimization also lacks consistency. Different engineers draw different conclusions from the same data, leading to configuration drift across environments. One team might lower CPU limits to cut cost; another might raise them to prevent throttling. Without a controlled testing process, there’s no reliable way to determine the impact of the changes.
And because these adjustments often happen in production, they carry risk. Updating resource requests or limits live can trigger throttling, restarts, or even cascading failures, exactly the problems optimization is meant to prevent.
To move beyond reactive tuning, teams need a way to validate configurations before deployment, under realistic load, and with reproducible results. That’s where automated, benchmark-driven approaches like BenchTest.dev make the difference, replacing intuition with data and making Kubernetes resource optimization both predictable and repeatable.
Automating Kubernetes Resource Optimization
Manual tuning can expose inefficiencies, but it rarely scales. Once a team has solid monitoring in place, the next step toward real Kubernetes resource optimization is automation; using repeatable, data-driven tests to validate configuration before it reaches production.
BenchTest.dev provides a framework for that shift. Rather than relying on historical metrics, it benchmarks live workloads in controlled environments, collecting CPU, memory, and latency data under realistic and repeatable load. The result is a precise understanding of how each container performs and how much capacity it truly needs.
Shift-Left Resource Optimization
Embedding performance tests into the development or CI/CD pipeline brings resource decisions closer to where code changes happen. This “shift-left” approach means developers can validate CPU and memory settings long before users feel the impact. BenchTest.dev automates these load tests, comparing results between versions and flagging when new code increases consumption or affects latency.
Instead of estimating requests from past production data, engineers can base every configuration on empirical evidence gathered during testing. That makes right-sizing a predictable, repeatable part of the delivery process.
Data-Driven Benchmarking
Each benchmark runs and maps resource usage against performance outcomes. Over time, these tests build a performance baseline, a record of how your workloads behave under different loads. From that baseline, teams can identify the smallest safe configuration that still meets performance goals. The same benchmarks can be re-run with every release to verify that optimizations hold true as code and dependencies evolve.
Continuous Optimization Through Automation
Integrating benchmarking into CI/CD turns resource tuning into a continuous process rather than a one-time exercise. Every build can trigger validation that ensures no regression in efficiency or stability. This consistency improves cluster utilization, reduces cost, and removes the guesswork from scaling decisions.
From Guessing to Knowing
With automated benchmarking in place, Kubernetes resource optimization becomes proactive instead of reactive. Teams deploy confidently, knowing their workloads have been tested under load, their requests and limits are backed by data, and their clusters are running as efficiently as possible.
Example: Finding the Right Requests with BenchTest.dev
Let’s look at how BenchTest helps teams translate benchmark data into the right Kubernetes resource requests, and how that data can feed directly into an autoscaler based on real application throughput.
Benchmark Setup
Imagine a small API container running a single HTTP service. The team isn’t sure how much CPU and memory the app really needs, so they start with safe defaults:
resources:
  requests:
    cpu: "1000m"
    memory: "512Mi"
  limits:
    cpu: "1500m"
    memory: "1Gi"
They deploy this configuration and use BenchTest.dev to run a 2-minute load test simulating 100 requests per second. BenchTest captures both performance metrics (requests per second, latency) and container-level metrics (CPU, memory) to build a full utilization profile.
Observing Utilization
Below are the CPU and memory utilization charts collected during the benchmark.
CPU Utilization
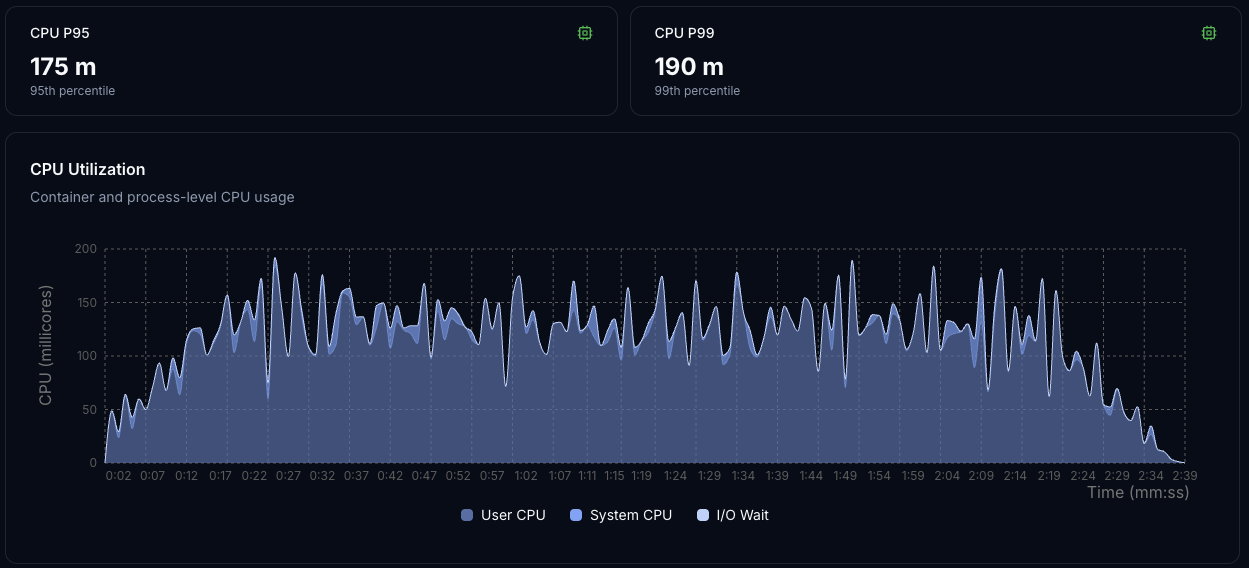
CPU usage stabilizes between 100–190 millicores (0.1–0.19 vCPU), even under peak load. The pattern shows small periodic spikes but no throttling, indicating that the workload is CPU-driven and predictable, with performance that scales consistently as load increases.
This utilization data shows how much CPU the workload consumes, but if you need to optimize further and understand where that CPU time is being spent in your application code, flame graphs can reveal the exact functions and code paths consuming the most CPU cycles.
Memory Usage
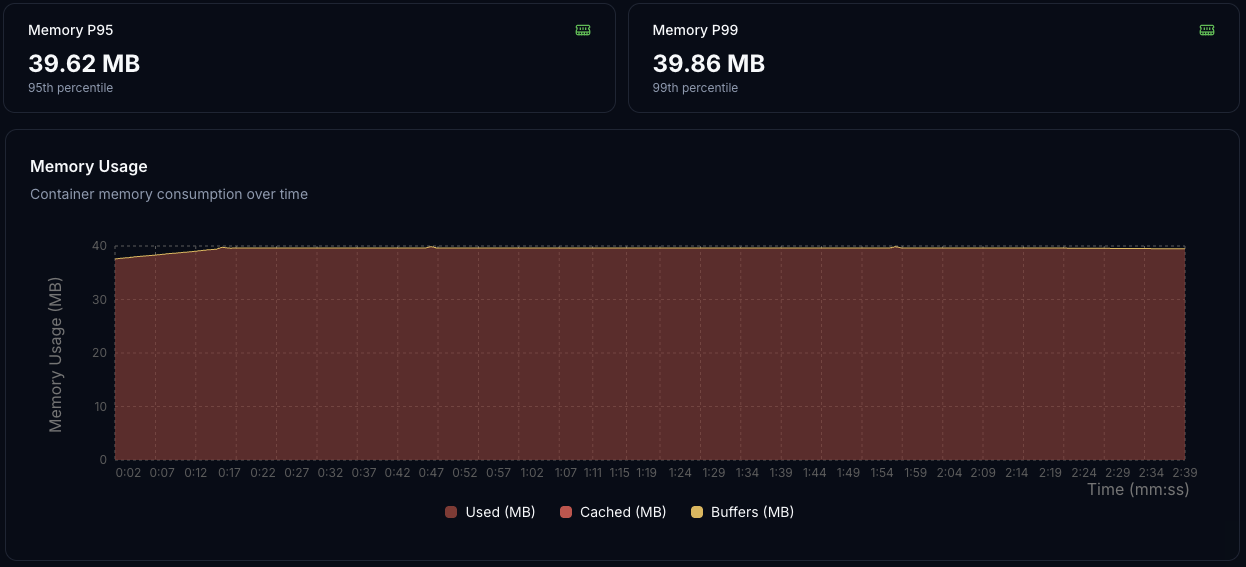
Memory consumption remains flat at ≈ 40 MiB. No growth or GC-related variation appears during load, meaning the app has a stable memory footprint.
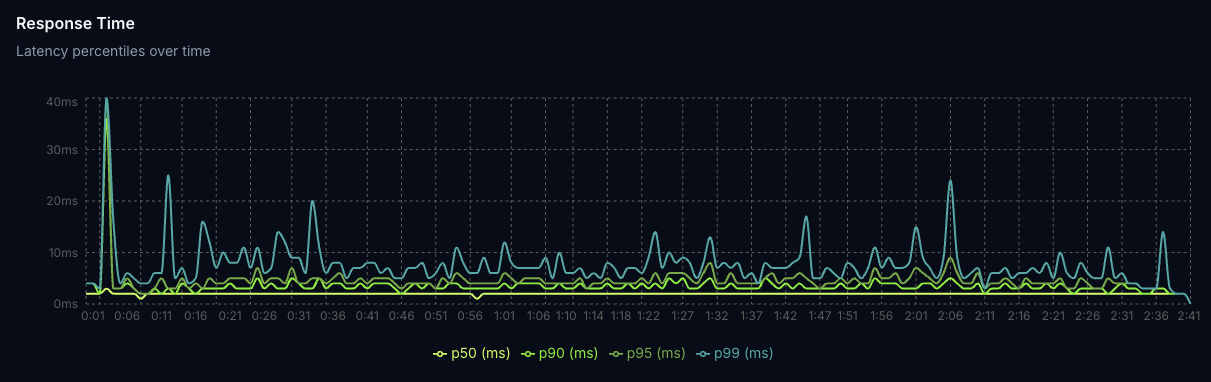
Response Time
Latency remains consistently low throughout the test, with median (p50) response times around 2 ms and 99th percentile latency on average around 7 ms. Occasional spikes appear mostly early in the test as the system warms up, but no sustained degradation is observed. This confirms that the workload maintains steady, low-latency performance even under sustained load, validating the CPU and memory profiles captured above.
Interpreting the Results
From these charts, BenchTest.dev computes utilization percentiles:
| Metric | p95 | p99 | Request (buffer) | Limit |
|---|---|---|---|---|
| CPU | 175 m | 190 m | 230 m (+20%) | 345 m |
| Memory | 40 MiB | 40 MiB | 52 MiB (+30%) | 78 MiB |
These recommendations follow a common best-practice pattern:
- Base requests on the 95th–99th percentile of observed usage plus a small buffer.
- Set limits at roughly 1.5–2× requests to allow short bursts without throttling.
This reduces overprovisioning by around 80% compared to the initial guess, freeing up cluster capacity while maintaining stable latency. Over time, as repeated runs confirm predictable performance, you can reduce that buffer to improve cluster efficiency without risking throttling.
Determining Requests per Second per Pod
During the same test, BenchTest.dev observed that a single container sustained ≈ 100 RPS while keeping p95 latency generally under 20 ms. That number, requests per pod at your latency SLO, becomes the ideal target for autoscaling.
The team exports this as a custom metric (http_requests_per_second) from their application and exposes it via Prometheus so that the Horizontal Pod Autoscaler (HPA) can react to demand.
Final Deployment and HPA Configuration
Here’s the final configuration that combines the benchmark results and autoscaling policy:
apiVersion: apps/v1
kind: Deployment
metadata:
  name: api-service
spec:
  replicas: 2
  selector:
    matchLabels:
      app: api-service
  template:
    metadata:
      labels:
        app: api-service
    spec:
      containers:
        - name: api
          image: yourrepo/api:latest
          ports:
            - containerPort: 8080
          resources:
            requests:
              cpu: "230m"
              memory: "52Mi"
            limits:
              cpu: "345m"
              memory: "78Mi"
---
apiVersion: autoscaling/v2
kind: HorizontalPodAutoscaler
metadata:
  name: api-service
spec:
  scaleTargetRef:
    apiVersion: apps/v1
    kind: Deployment
    name: api-service
  minReplicas: 2
  maxReplicas: 20
  metrics:
    # Scale on custom RPS metric from Prometheus
    - type: Pods
      pods:
        metric:
          name: http_requests_per_second
        target:
          type: AverageValue
          averageValue: "100"
    # Secondary guardrail on CPU utilization
    - type: Resource
      resource:
        name: cpu
        target:
          type: Utilization
          averageUtilization: 85
This configuration ensures:
- Each pod can handle ~100 RPS at the desired latency.
- CPU and memory are right-sized based on measured utilization.
- The HPA adds pods when average load per container exceeds 100 RPS or CPU surpasses ~85% utilization.
- Secondary CPU guardrail to reflect real system load and prevent throttling when workload behavior changes as safety net.
Results
- CPU requests reduced: 1000 m → 230 m (−77%)
- Memory requests reduced: 512 Mi → 78 Mi (−85%)
- Consistent latency under load
- Predictable autoscaling: pods scale out linearly with real traffic
- Lower cost and higher density across the cluster
Takeaway
This example shows how BenchTest.dev turns performance testing into actionable configuration. By benchmarking containers before deployment, teams can:
- Quantify real per-container throughput (RPS at SLO),
- Derive CPU and memory requests empirically, and
- Feed those insights into an autoscaler for predictable scaling behavior.
Over time, as confidence grows and production metrics confirm stability, teams can use this data to go further:
- Increase node density by safely reducing CPU and memory requests, based on proven utilization patterns.
- Improve reliability by tightening limits to prevent noisy-neighbor effects and resource contention.
- Boost overall cluster efficiency by scaling on empirical throughput (http_requests_per_second) and gradually raising CPU utilization targets, achieving higher density without throttling or instability.
Empirical, benchmark-driven sizing like this eliminates guesswork and builds confidence that every container, and every cluster node, is doing exactly the right amount of work.
Conclusion: From Reactive Tuning to Proactive Optimization
Kubernetes resource optimization used to depend on intuition; watching dashboards, adjusting YAML, and hoping the next deployment performed better. That approach wastes time, resources, and focus.
Empirical, benchmark-driven methods change the game. By testing workloads under realistic load before they reach production, teams can define requests and limits with confidence, align autoscaling with real throughput, and keep clusters efficient without sacrificing reliability.
Automation closes the feedback loop. Each release validates resource behavior automatically, preventing drift and turning optimization into part of normal development rather than an after-hours firefight.
Over time, these practices do more than cut costs:
- Density increases, because requests are sized from evidence, not guesswork.
- Reliability improves, as limits are tuned precisely to workload behavior.
- Utilization rises, through scaling policies based on real requests-per-second and measured efficiency.
That's the evolution from reactive tuning to proactive engineering, where Kubernetes resource optimization isn't an ongoing struggle but a measurable, automated outcome of the development process.
References
[1] Kubernetes Horizontal Pod Autoscaler documentation. https://kubernetes.io/docs/tasks/run-application/horizontal-pod-autoscale/
[2] Kubernetes Vertical Pod Autoscaler documentation. https://github.com/kubernetes/autoscaler/tree/master/vertical-pod-autoscaler
[3] Kubernetes Cluster Autoscaler documentation. https://github.com/kubernetes/autoscaler/tree/master/cluster-autoscaler
[4] Google Cloud. Kubernetes best practices: Resource requests and limits. https://cloud.google.com/blog/products/containers-kubernetes/kubernetes-best-practices-resource-requests-and-limits
Ready to optimize your container performance?
Start profiling your containers with performance insights. No credit card required.